14 min read  •  10 min listen

Visual Clarity

How to Make Every Chart Count (and Look Good Doing It)

Visual Clarity

AI-Generated

April 28, 2025

You want your data to speak for itself—loudly, clearly, and with style. This tome shows you how to make every chart count, from picking the right plot to making sure everyone can read it. If you’ve ever wondered how to make your visuals both sharp and smart, you’re in the right place.


Start Strong: Building Your Visual Foundation

Two glowing line charts, one blue and one orange, hover above a sleek holographic console in a neon-lit room to illustrate clean data-first design

A strong chart starts with a clear visual plan. Keep the spotlight on the data so viewers grasp the point in seconds. Remove fancy effects that distract, and your message stays sharp.

What Makes a Good Chart?

Vintage brass gears balance useful data ink against ornate decoration, highlighting the cost of clutter

Simple choices beat flashy tricks. Two colored lines and clear axes tell the temperature story better than rainbows, shadows, or five fonts. High clarity and honest scales earn trust. Ask yourself: “Can I understand this in three seconds?” If not, trim the extras.

Blueprint shows a rectangle labeled Figure containing smaller boxes labeled Axes, mapping chart structure

Meet Your Tools: Anatomy of a Matplotlib Figure

Think of a Figure as a blank page. Inside it, each Axes holds one plot. A scatter next to a histogram means two Axes in the same Figure. Inside every Axes live x- and y-axis rulers that give the plot scale and labels.

Chalkboard plot with light grid lines, bold axes, and chalk labels under a warm spotlight

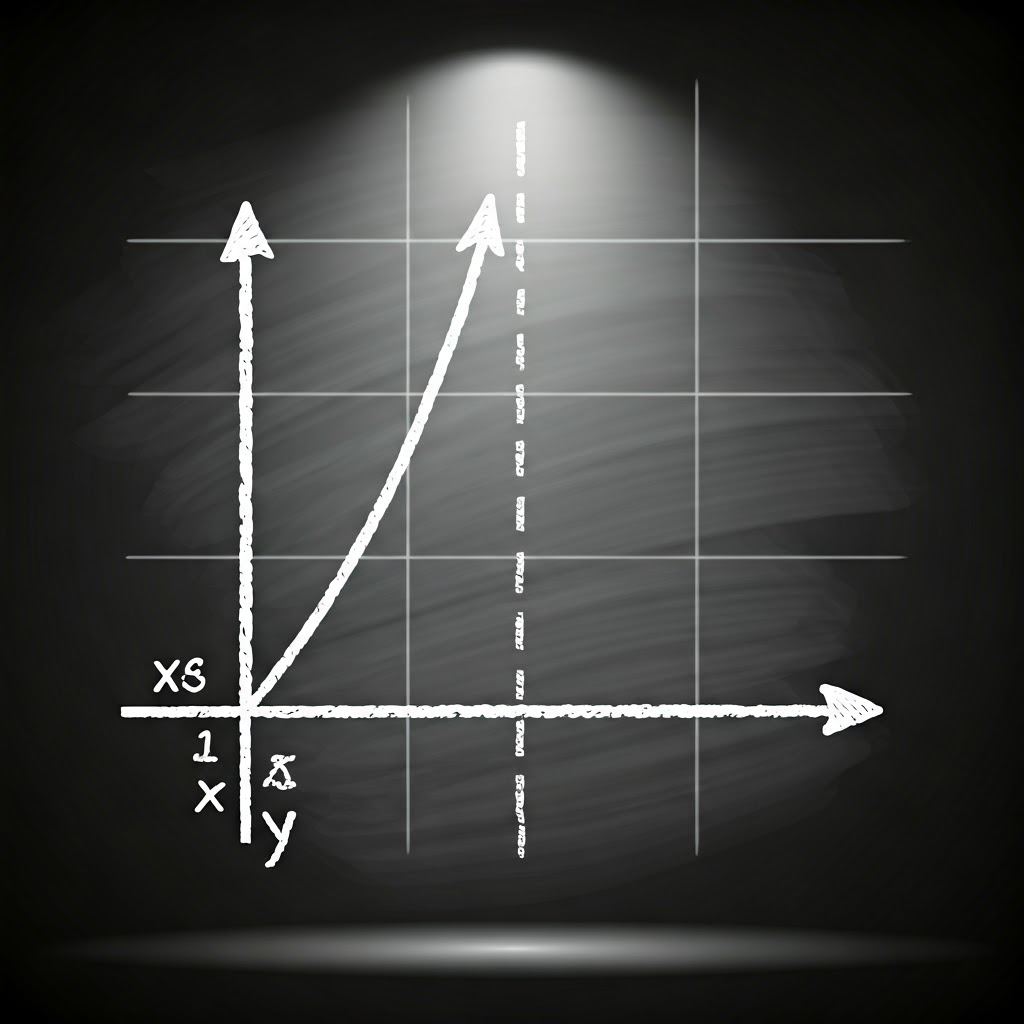
Grid lines guide the eye but should stay light. Lines, bars, or points are the real stars. Remember: one Figure can house several Axes, and each Axes owns its own axes. Keep that hierarchy clear to avoid “no axes” errors.

import matplotlib.pyplot as plt

fig, ax = plt.subplots()
ax.plot([2020, 2021, 2022], [5, 6, 7])
ax.set_title("Steady Growth")
ax.set_xlabel("Year")
ax.set_ylabel("Value")
plt.show()

Surreal floating book and nameless map under a twilight sky stress the need for titles and labels

Titles, Labels, Legends, and Annotations: The Unsung Heroes

A chart without labels feels like a book with no title. A clear title such as “Monthly Coffee Sales, 2023” frames the story instantly. Axis labels explain units, saving viewers from guesswork.

Pop art chart with legend and arrows highlights how color keys clarify multiple data lines

Use a legend only when you plot more than one series. One line? Skip it. Annotations act like sticky notes that call out spikes or dips without clutter. They guide attention to the key moment.

ax.annotate("Sales drop", xy=(5, 200), xytext=(6, 220),
            arrowprops=dict(facecolor='black', shrink=0.05))

Side-by-side charts compare unlabeled versus clearly labeled examples for instant comprehension

Before and after views show how labels flip confusion into clarity. Short titles, readable fonts, and light grid lines make a chart friendly. If you need more than five legend colors, consider splitting the data.

Retro desk with one cluttered chart and one clean chart underscores the power of good labeling

Keep fonts at least size 10, limit colors, and be honest with scales. When you respect these basics, you help everyone see what matters and set the stage for true visual clarity.


Tome Genius

Data Science with Python: From Data to Insights

Part 5

Tome Genius

Cookie Consent Preference Center

When you visit any of our websites, it may store or retrieve information on your browser, mostly in the form of cookies. This information might be about you, your preferences, or your device and is mostly used to make the site work as you expect it to. The information does not usually directly identify you, but it can give you a more personalized experience. Because we respect your right to privacy, you can choose not to allow some types of cookies. Click on the different category headings to find out more and manage your preferences. Please note, blocking some types of cookies may impact your experience of the site and the services we are able to offer. Privacy Policy.
Manage consent preferences
Strictly necessary cookies
Performance cookies
Functional cookies
Targeting cookies

By clicking “Accept all cookies”, you agree Tome Genius can store cookies on your device and disclose information in accordance with our Privacy Policy.

00:00