
Reading the Thermometer: Modern Tools for Tracking Climate
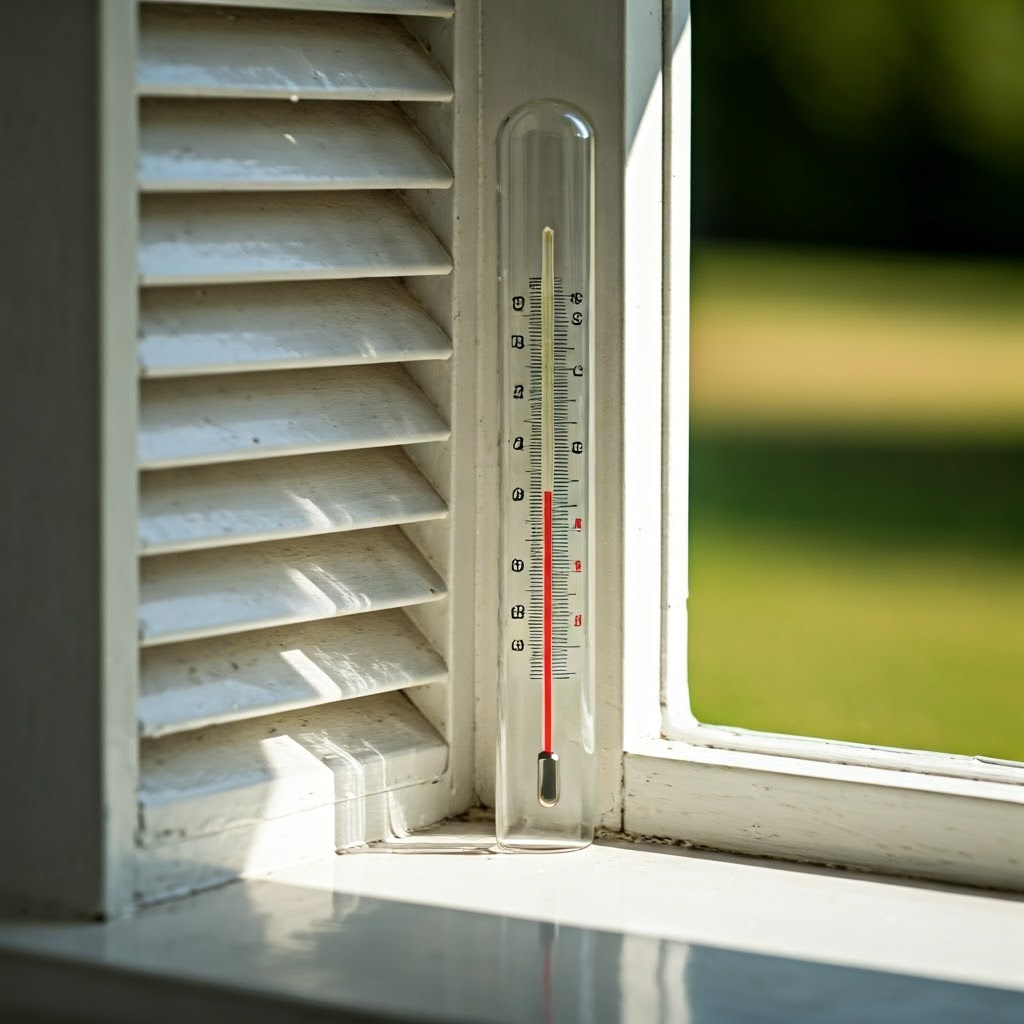
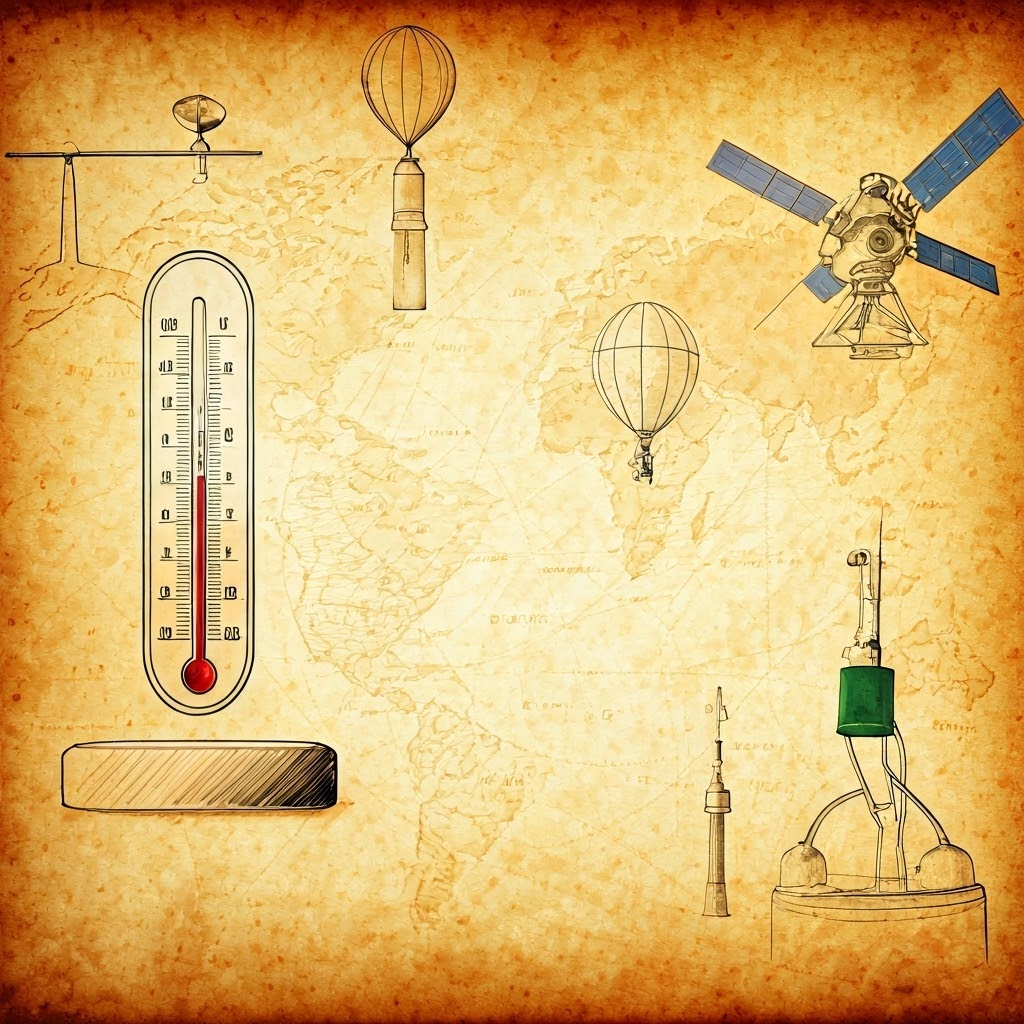
When you want to know the outside temperature you look at a thermometer. This slim glass tube holds a liquid that rises when it warms and falls when it cools. For accuracy we place the instrument in a white louvered Stevenson screen, safely above the ground.
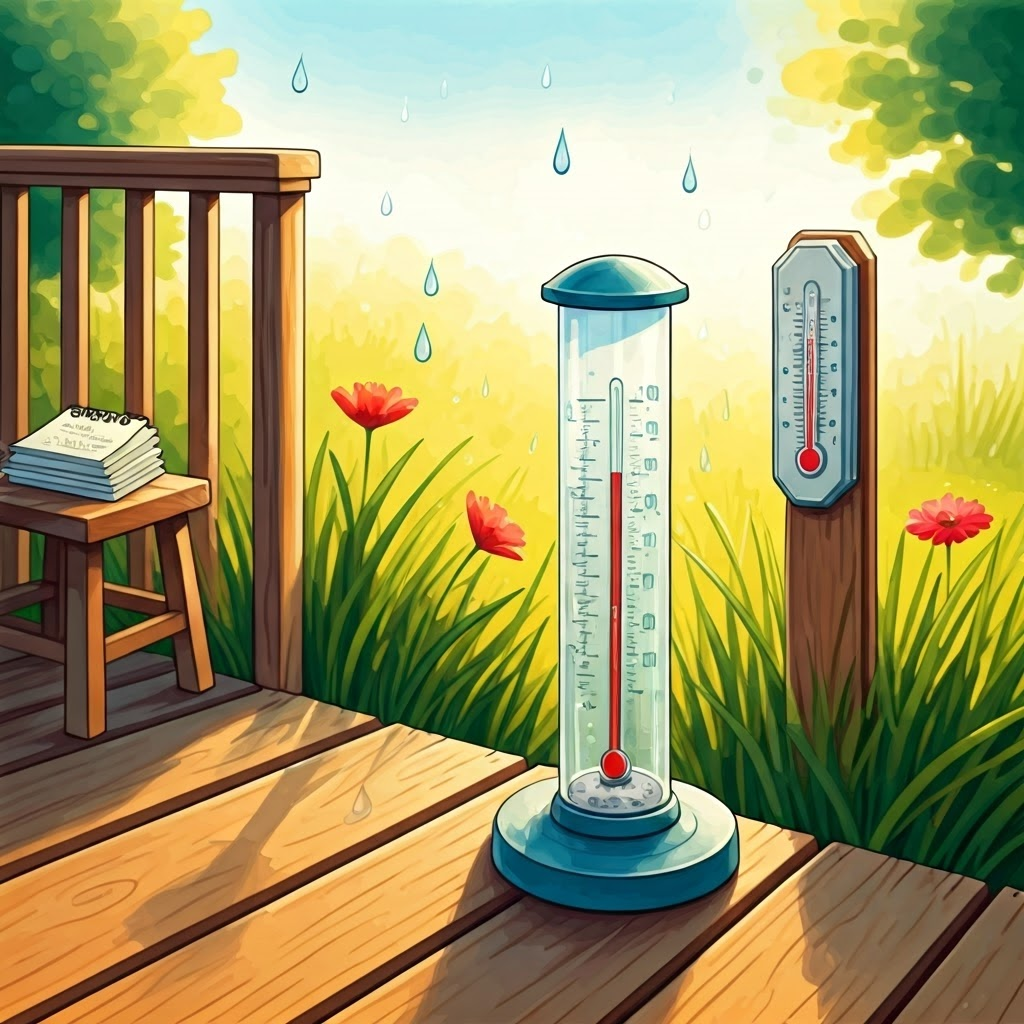
Measuring rainfall uses a straight-sided rain gauge marked in millimeters. Every millimeter collected equals one millimeter of rain per square meter. Gauges sit in open areas away from trees or walls so nothing blocks rain or wind.
Backyard observers often read their gauges at set times. That steady routine—same tools, same place—lets us spot real trends rather than random blips.
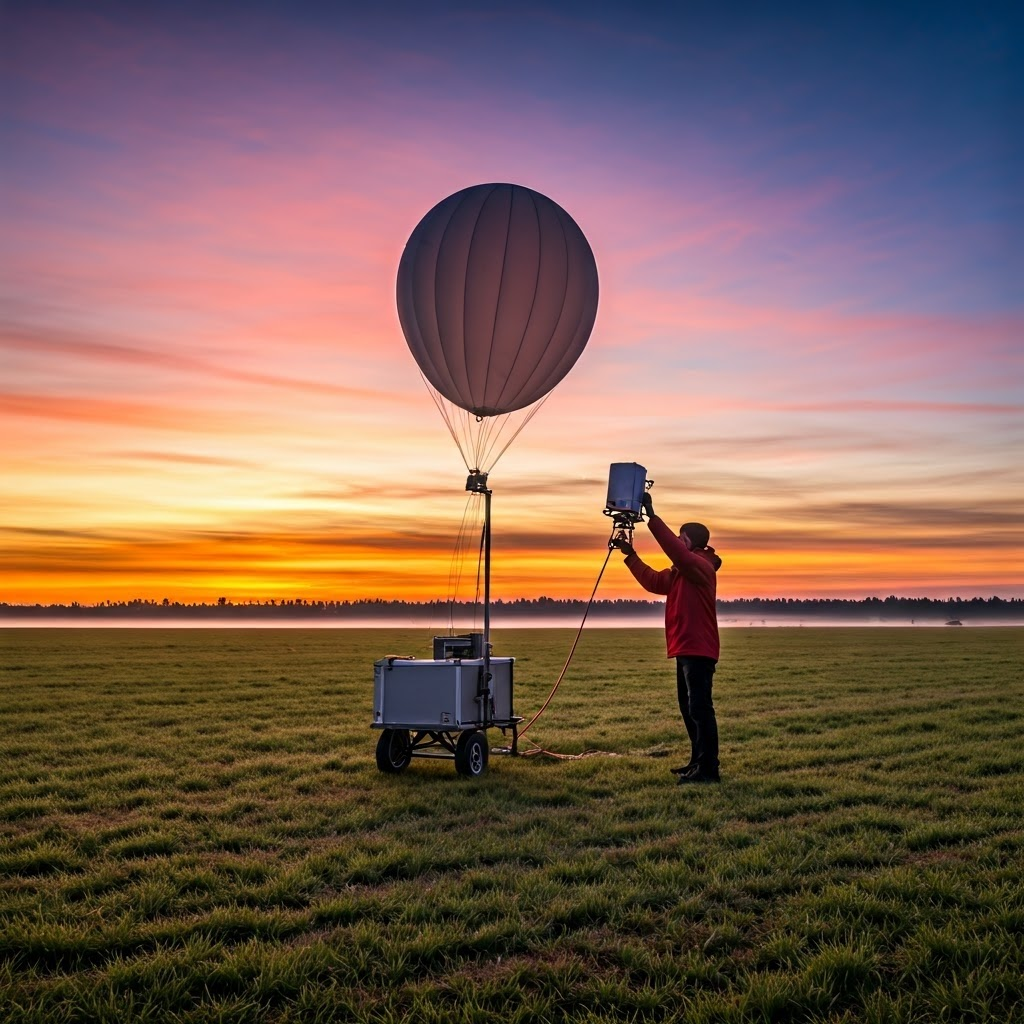
To understand conditions aloft, technicians launch a weather balloon each morning. Filled with helium or hydrogen, the balloon carries a radiosonde that senses temperature, humidity, and pressure up to about 32 kilometers.

As the balloon climbs, the radiosonde beams real-time data to ground stations. It shows how temperature drops, where clouds form, and where the stratosphere begins. When the balloon bursts, the package drifts back by parachute, and a new launch happens the next day.
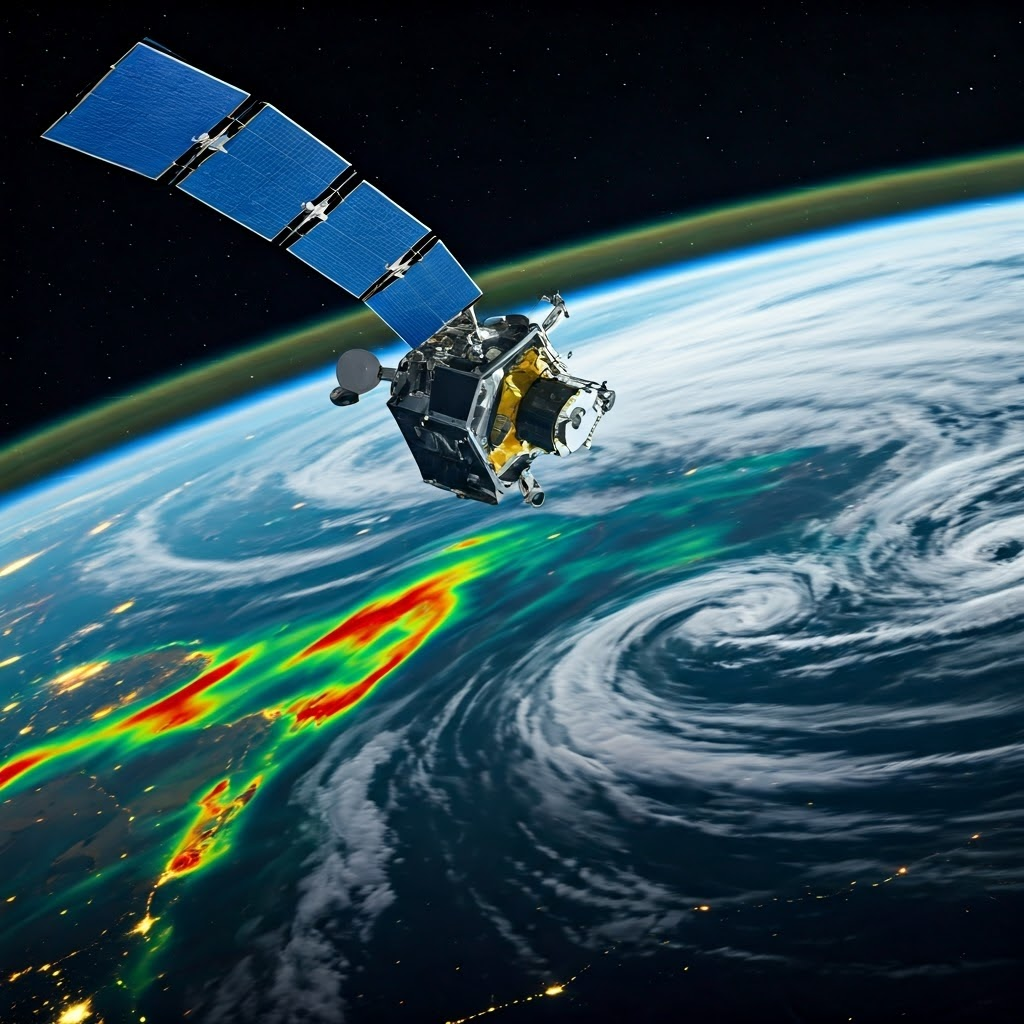
For a world-wide view, orbiting satellites watch Earth day and night. Polar-orbiters scan pole to pole; geostationary craft hover over one spot. Together they map surface temperature, clouds, ocean color, and more, filling gaps that ground stations miss.
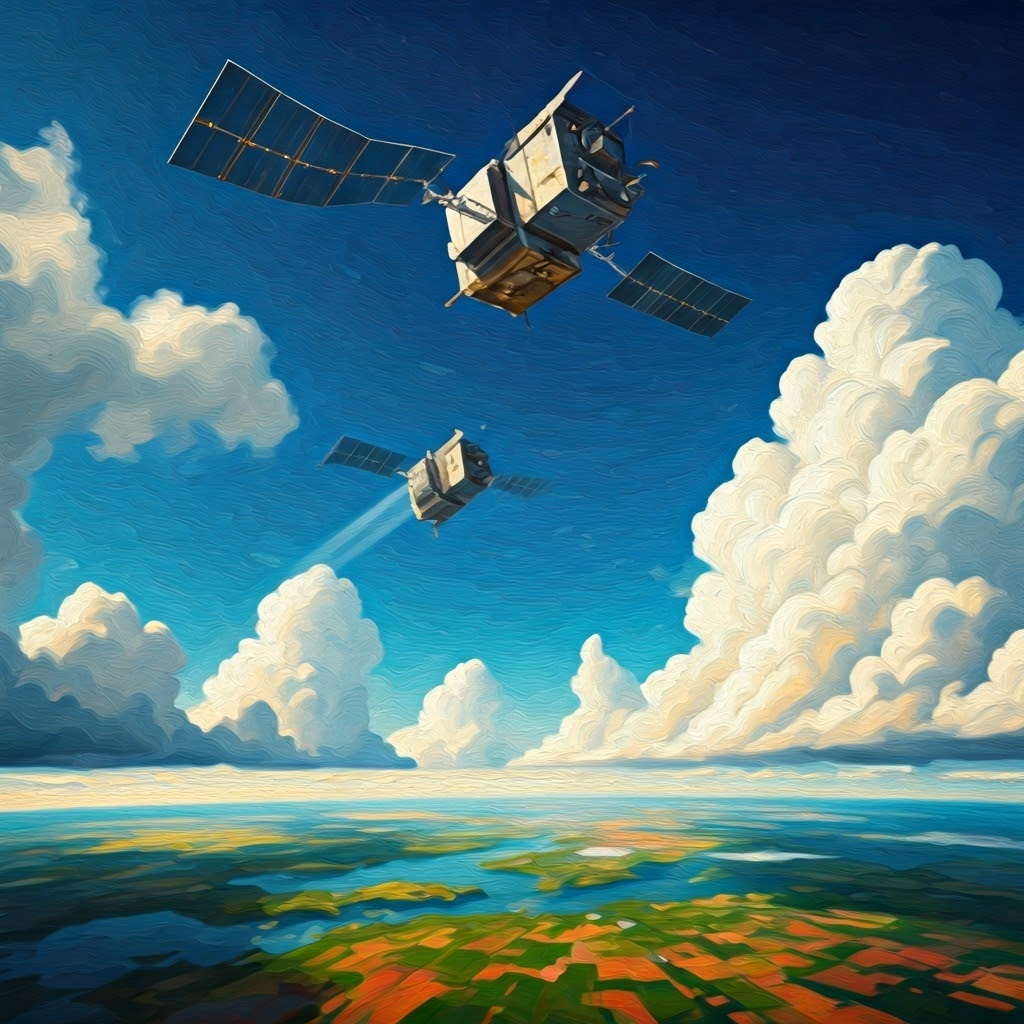
NASA’s Aqua circles from pole to pole, measuring water vapor and snow. NOAA’s GOES hovers over the Americas, sending images every few minutes. Europe’s Sentinel fleet tracks air quality and fires. This steady stream of orbital data keeps our climate picture complete.

Because oceans cover most of the planet, anchored buoys act as sea-based weather stations. They record surface temperature, wind, and wave height, then relay the numbers by satellite. A buoy near Galveston, for instance, updates Gulf conditions every hour.

More than 3,000 autonomous Argo floats drift with currents. Every ten days they dive about 1,600 meters, log temperature and salinity on the way up, then transmit their profiles. This network shows how oceans store heat and how patterns like El Niño develop.
Working together, these tools—thermometers, gauges, balloons, satellites, buoys, and floats—create a layered observing system. Overlapping records from land, sky, and sea reveal clear evidence: winters warm, oceans heat, and rainfall shifts. Careful measurements, not guesses, chart our changing climate.