
From Equations to Earth: Building a Digital Planet

Turning Physics into Code
A climate model acts like a giant calculator for the planet. It stretches the familiar laws of physics—such as energy conservation—across a spinning globe. Scientists translate these rules into computer code because neat equations alone cannot capture Earth’s messy reality.

Researchers rewrite the equations into clear steps a computer can repeat. Simple energy-balance models test big ideas quickly. General circulation models add storms and currents, offering richer detail but demanding more computing power—like comparing a microwave meal to a gourmet feast.

Both model types have value. Simple versions reveal broad patterns fast, like using a map. Complex models answer focused questions—how the Gulf Stream shifts heat, or how deforestation alters clouds—but they need stronger computers and extra patience.

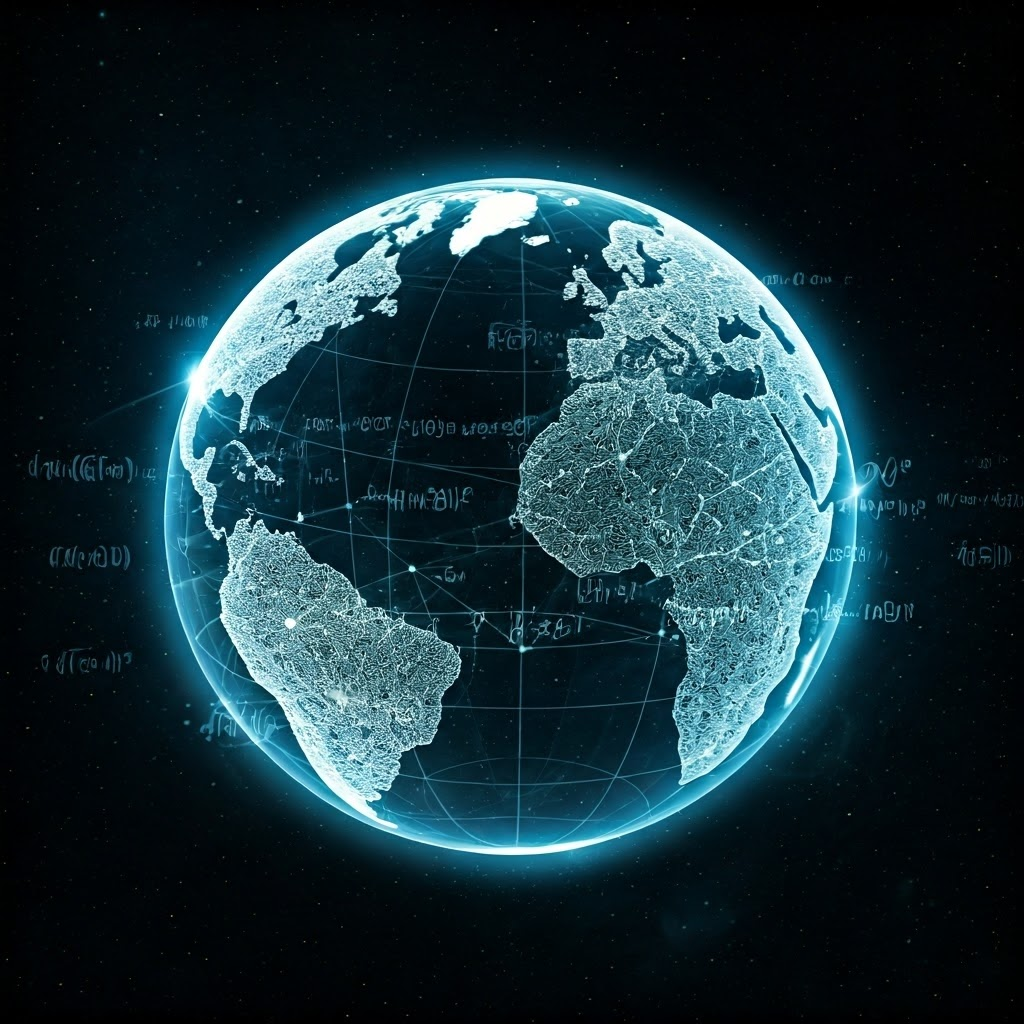
The Digital Planet: Grids and Layers
Modelers slice Earth into a 3D grid—think Lego bricks snapped into a sphere. Each grid cell stores local weather: temperature, wind, humidity, even plant growth. This grid lets computers handle the globe piece by piece.

The computer solves equations for every cell, then jumps ahead a few minutes in a loop called time-stepping. Finer grids give sharper detail but slow the run—much like HD video versus pixel art.
Earth has many layers: air, oceans, land, and ice. These parts interact each step—warm air melts ice, changing currents that then alter the air. The model’s power lies in letting these systems talk continuously.

Connecting the Pieces
Linked systems produce real patterns such as El Niño. A cold Pacific patch can reshape California rainfall. Omit a region—say, the Southern Ocean—and the digital planet behaves nothing like the real one.

Clouds, Chaos, and Clever Shortcuts
Some features, like clouds, are smaller than a grid cell. Modelers use parameterization—rules and averages—to capture their overall effects instead of every droplet.
Think of predicting highway traffic. Measuring every vehicle is impossible, so you average speed and volume. Climate scientists apply the same idea to rainfall, turbulence, and plant growth.
Parameterization keeps models practical but adds uncertainty. If cloud rules misfire, the model skews results. Researchers constantly refine these shortcuts using new data to improve realism.
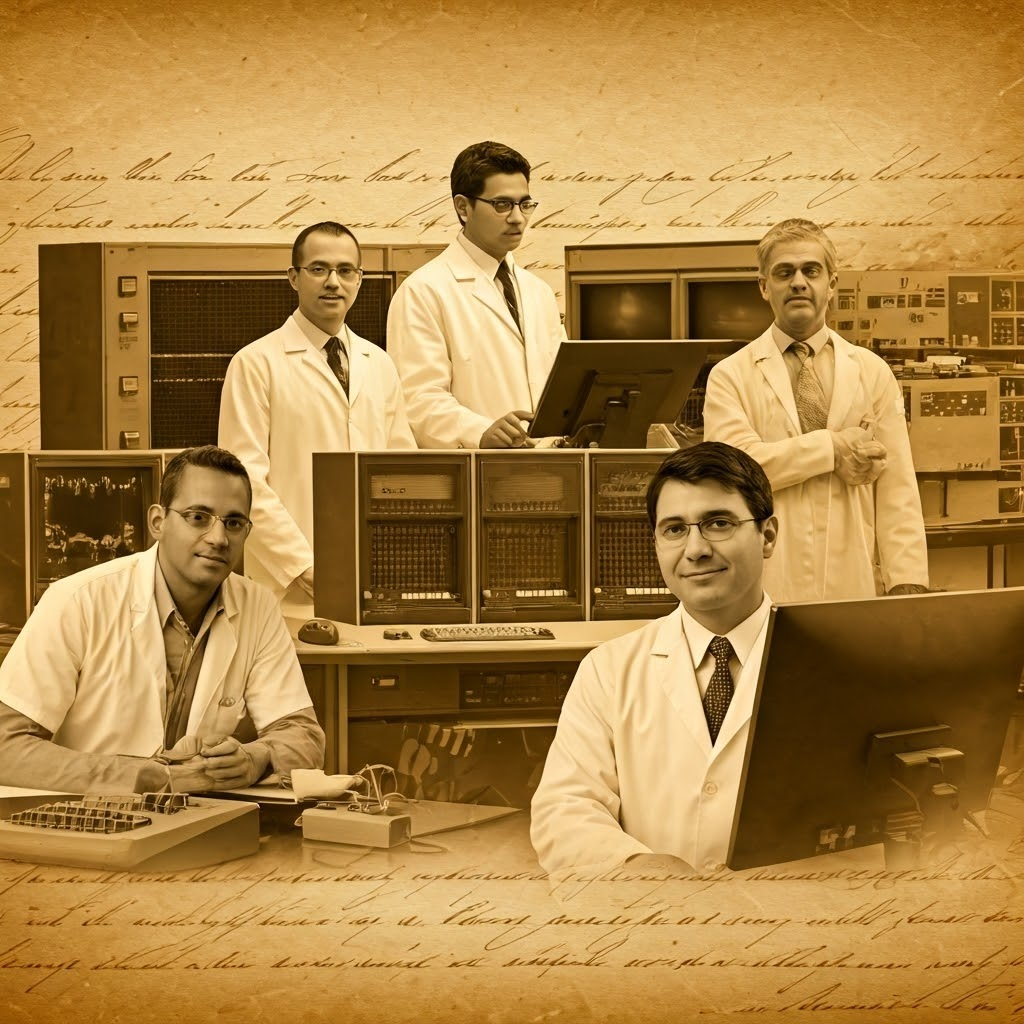
Meet the Model Makers
Syukuro Manabe pioneered stacking atmospheric layers to see how carbon dioxide warms Earth. His early work still guides modern models. Claudia Tebaldi advances how we interpret outputs, turning complex data into clear risk insights.

Model building is a team sport. Atmospheric experts, oceanographers, and data wranglers collaborate across continents. Releasing a new model version can take years of coding, testing, and debate—it’s like constructing a city that must forecast next year’s weather.
Why This All Matters
Climate models are not crystal balls. They organize what we know and project what could happen. Each equation, shortcut, and line of code sharpens our view of the future. You don’t need to be a scientist to value how these tools transform invisible global patterns into something you can see, question, and learn from.